


Weighted On Target Percentage: Charting the 2023 NFL Draft Quarterbacks
Every curious about how your favorite 2023 NFL Draft quarterback looks on a week-to-week basis? I've got you covered.


The 2023 NFL Draft is year-three for me charting draft-eligible quarterbacks.
Now entering a class with Ohio State’s C.J. Stroud, Alabama’s Bryce Young, Florida’s Anthony Richardson, Kentucky’s Will Levis, and more, most of the kinks are worked out. The spreadsheet attached below will contain all of the data for the class and will remain pinned to the top of this site.
You can view each actual chart of each game on a larger scale by clicking the full screen link as well. This chart will be updated as fast as I can get to them as I navigate my full-time job, writing gigs, and life as a father to an ever-growing child.
The Concept behind Weighted On-Target %
Before we get to colors and codes, the premise of Weighted On-Target Percentage revolves around the idea that big-time plays and high-leverage throws create points.
Patrick Mahomes and Josh Allen are not the most accurate passers in the NFL. This is a pretty well-known concept. This is not to say that they are not accurate, but accuracy is not what they pride themselves on.
What they pride themselves on is the ability to deliver deep down the field and along the boundaries at a high level to create chunk plays at a high level and with a higher volume. This is why I weigh these big time throws with a more substantial weight than an intermediate throw over the middle or throws that work the short game (without completely disparaging the need for these levels as well).
All-in-all, Weighted On-Target Percentage hopes to identify those quarterbacks who have the ability to drive the ball towards the boundary and deep down the field at a high level (while remaining efficient underneath and over the middle) and elevate them over quarterbacks who are efficient working shallow and underneath concepts but fear pushing the football.
Weighted On-Target % Glossary
The charts themselves, while I have attempted to make them as digestible as possible, are still in need of a glossary. Here is an example of a chart, which is C.J. Stroud’s historic performance against Georgia in the 2022 Semi-finals.
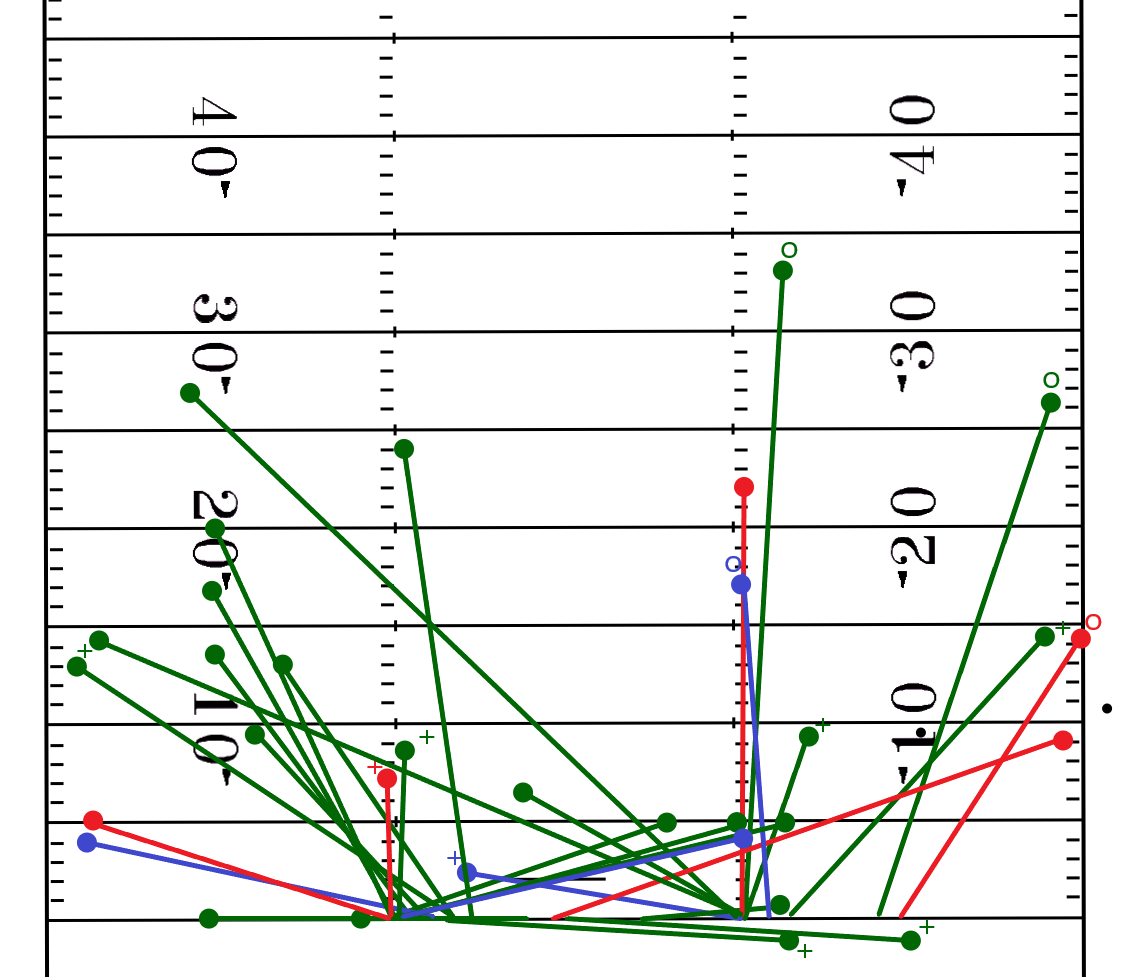
The first thing to mention is that throws are charted from the line of scrimmage to the WR depth. Lines start from where the ball was thrown to where the throw landed.
Five different colors to be mindful of
Five colors will appear on charts to take into consideration. Here is what each of those colors means:
Green: On-target throw and completed
Blue: On-target throw but incomplete (drop, bad track, etc.)
Red: Off-target throw and incomplete
Yellow: Off-target throw but caught (receiver bails out QB, screen passes that cause receiver to slow momentum and change directions, wrong shoulder on leveraged throws)
Black dot: unchartable throw: clocked football, throwaway, uncalled PI, miscommunication between QB and WR, etc.

Two codes will show up
There are two codes that show up on charts as well:
O: This signifies a throw that is made outside of structure.
+: This signifies a throw that is made beyond the quarterback’s first read
Digesting the Chart
Looking at this chart from Stroud’s game against Georgia, he had a handful of outside of structure throws that really stood out from this performance. Those are clearly marked with the code listed above.
He had more than just a few looks beyond his first read, and had a few throws that were left on the field by his receivers. Stroud, efficient at every level of the field, played the best game of his career in his final showing in the scarlet and grey.
If there are any other questions you have about these charts feel free to reach out via Twitter at @realcorykinnan.